

CellMap: Building a Living, Breathing Cell You Can Explore
What happens when you try to model the real complexity of a human cell — not a textbook diagram, but the actual molecular machinery?
Most of us carry a mental image of a cell that hasn't changed much since high school biology. A wobbly circle. A nucleus somewhere in the middle. Maybe a few mitochondria floating around like jelly beans. It's a useful simplification, but it's also a lie — the kind of lie that makes you think you understand something when you really don't.
CellMap is an attempt to fix that.
What Is CellMap?
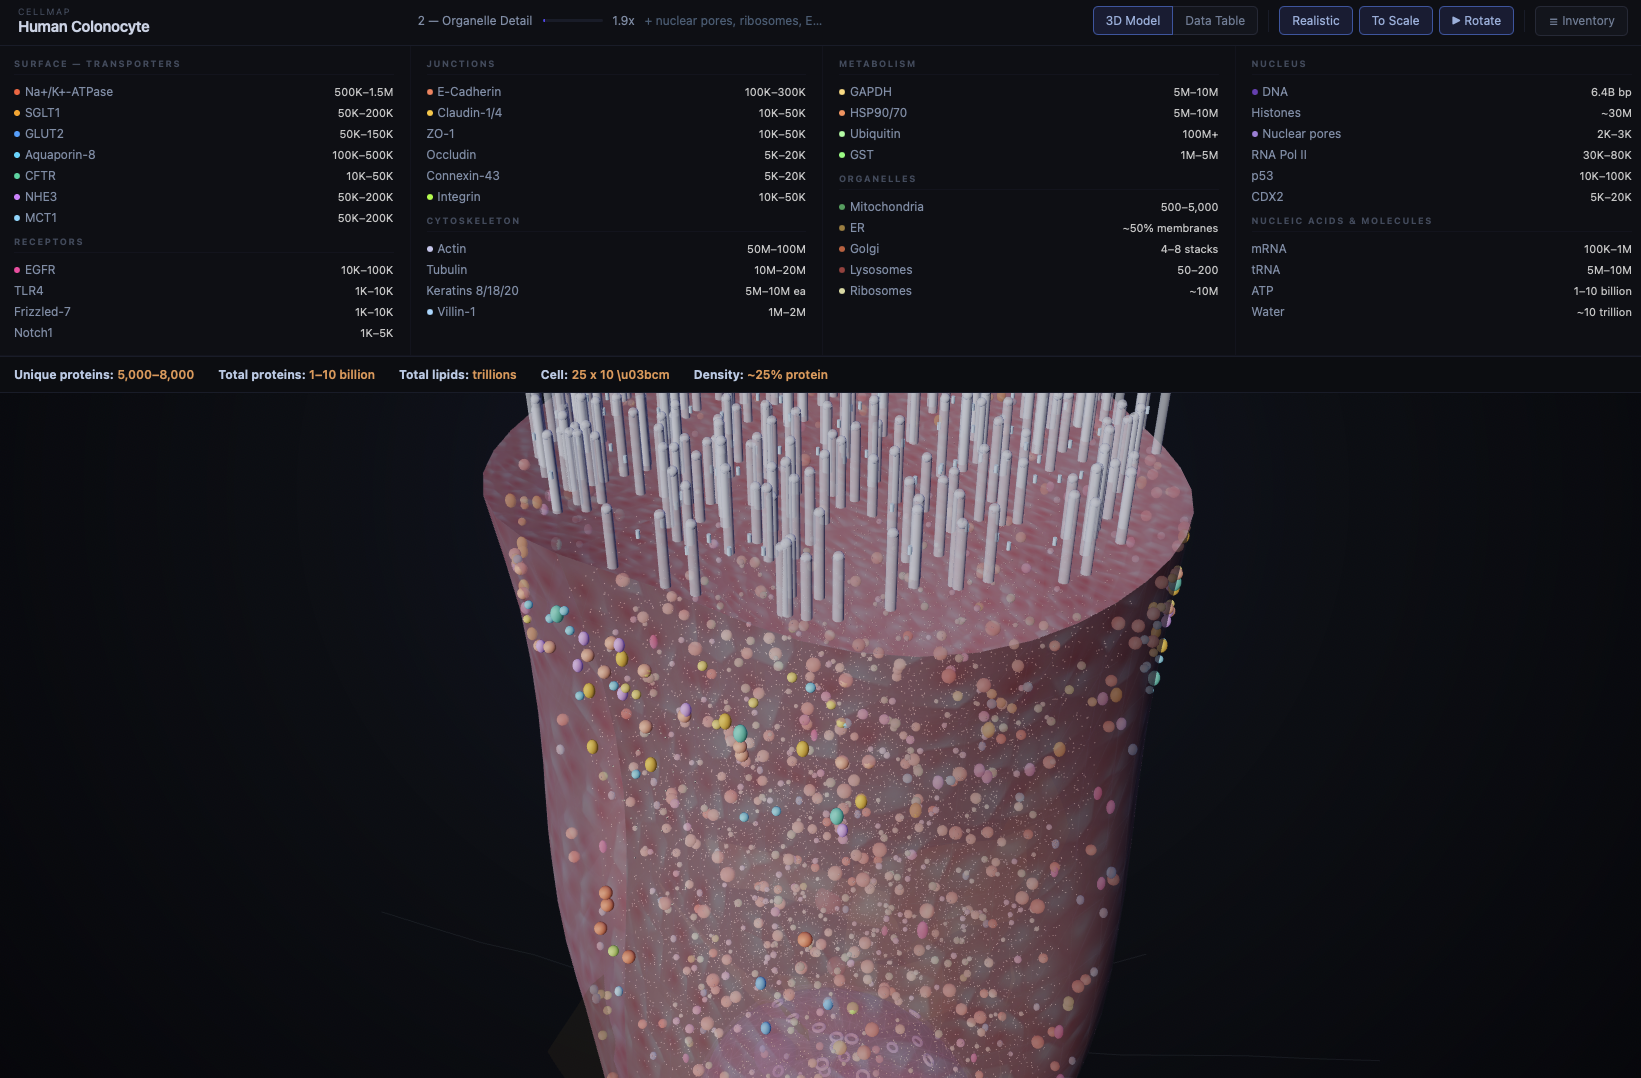
CellMap is an interactive 3D atlas of a human cell — specifically, a colonocyte (a cell that lines the colon). Built entirely with Three.js and rendered in a web browser, it lets you zoom from the whole-cell view down through five levels of detail until you're looking at individual protein structures resolved from crystallography data.
It's not a game. It's not a screensaver. It's a working model with over 1,230 proteins placed across 18 different types, organelles rendered in context, and real atomic structures sourced from the Protein Data Bank (PDB). Hover over a protein and you'll see what it is. Click and you'll see its actual molecular geometry — tens of thousands of atoms arranged exactly as they exist in nature.
Why a Colonocyte?
The colon is one of the most metabolically active environments in the human body. Colonocytes are the frontline cells — absorbing water and electrolytes, maintaining the mucosal barrier, and constantly renewing themselves. They're also ground zero for colorectal cancer, one of the most common cancers worldwide.
Understanding how these cells work at a structural level isn't an academic exercise. It's directly relevant to drug development, cancer research, and the emerging field of computational biology. A colonocyte seemed like the right place to start: complex enough to be genuinely useful, specific enough to be scientifically grounded.
How It Works
CellMap uses a level-of-detail (LOD) system with five zoom tiers. At the widest view, you see the whole cell — membrane, nucleus, organelles positioned in biologically accurate locations. As you zoom in, the model progressively reveals more detail: protein clusters become individual molecules, and individual molecules resolve into their atomic structures.
The protein placement isn't random. Each of the 1,230+ proteins is positioned according to its known subcellular localisation — membrane-bound receptors sit in the membrane, ribosomal proteins cluster on the endoplasmic reticulum, mitochondrial enzymes are inside mitochondria. It's an approximation, but a principled one.
Behind the scenes, 66 PDB structure files provide the raw atomic coordinates, with 12 proteins currently parsed into the rendering engine — representing roughly 41,000 individual atoms. An inventory panel and data table let you browse what's been placed and where.
The Bigger Picture
There's a gap in biomedical education and research tooling. On one end, you have static textbook diagrams. On the other, you have specialist molecular visualisation software like PyMOL or Chimera that requires training and domain expertise to use effectively. In the middle — where most clinicians, students, and curious people actually sit — there's not much.
CellMap lives in that middle space. It runs in a browser. It requires no installation, no license, and no background in computational biology. You open it and start exploring.
The long-term vision is broader than a single cell type. The architecture is designed to support additional cell types, comparative views between healthy and diseased states, and integration with emerging spatial transcriptomics data. A migration to Next.js is planned to support richer interactivity and collaborative features.
Built with AI
CellMap was built entirely through AI-assisted development — part of a portfolio of healthcare technology projects developed using Claude as the primary engineering partner. Every line of code, every protein placement algorithm, every rendering optimisation was developed collaboratively between a non-traditional developer and an AI.
That's worth mentioning not as a novelty, but as evidence. If a solo founder with no computer science degree can build a scientifically grounded, interactive 3D molecular atlas in a web browser, the barrier to building meaningful scientific tools has fundamentally changed. The question is no longer can it be done — it's what should we build next.
What's Next
The immediate roadmap includes integrating full PDB atomic models on click interaction, refining the nucleus rendering, and migrating the codebase to Next.js for better performance and extensibility. Longer term, the goal is to make CellMap a reference-quality educational and research tool — something a medical student could use to understand cell biology, and a researcher could use to contextualise their work.
The cell is the fundamental unit of life. It deserves better than a wobbly circle.
CellMap is a project of the Medware Group. For more information, contact matt@medware.com.au